.png)

Cloud Campaign compares your social website traffic to your optimal traffic to generate a 'quality score'.

So how do we calculate that number and what does it mean?
What We Measure
- Average Session Duration
- Pageviews per Session
- Bounce Rate
How is it scored?
The score is in the range of 0 - 100 inclusively.
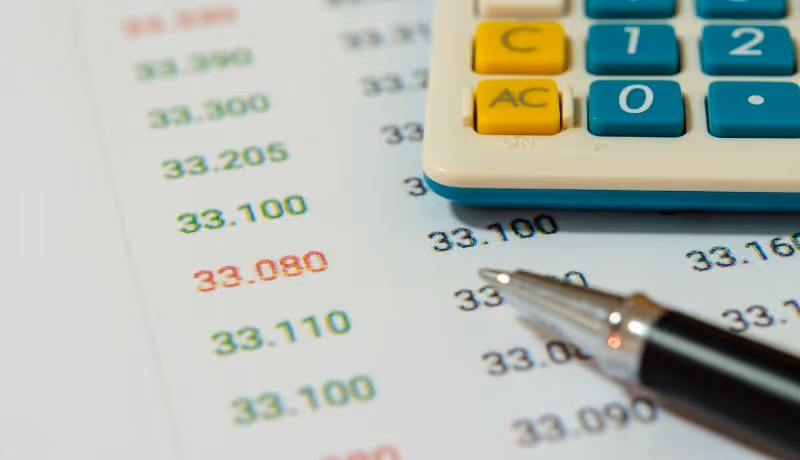
We look at the "best" performing traffic for each metric and compare that to the average values for all social channels.
This gives us a raw traffic score.Next, we map the raw traffic score to a quality score that is an indication of your social traffic's health.
The equation we use for that is as follows:traffic_health = (log2(raw_score) + 10)^3 * 0.021703248
I won't go into detail about how we derived that equation, but it ultimately works as a limit function due to the logarithmic calculation.
Small changes early on will have large improvements to your score, while once you have healthy traffic, your web traffic score will only increase marginally.


Want to grow without expanding your fulfillment team?
CloudStudio helps agencies automate the technical grind of social media management so your team can spend less time posting and more time growing accounts. Reserve your spot now.


.png)


.avif)


.avif)


.avif)